
Every September, a Fleming Island homeowner asks me some version of the same question: is now a good time to sell a house in Fleming Island, or should I wait for spring? Most of the answers online are a shrug. “It depends on your situation” is true, but it is useless when you are deciding whether to spend the next ninety days getting a house ready.
Instead, I went to the MLS. I pulled 24 months of single-family data for Fleming Island, September 2024 through August 2026, and looked at the four numbers that decide what a seller keeps: active inventory, days on market, sale-to-list price ratios, and contracts written.
The short answer is yes. Now is a good time to sell a house in Fleming Island if you can be on the market by early October. The longer answer is about what happens to those four numbers in November, and why the calendar matters more than the mortgage rate headlines.
Is now a good time to sell a house in Fleming Island?
Yes. As of August 2026, Fleming Island sellers face less competition and faster sales than a year ago, and the historically weaker November-to-January stretch has not started yet. Specifically, the MLS shows 101 active single-family listings in August 2026, down from 127 in August 2025, a drop of about 20 percent.
In addition, homes are moving faster: average days on market for closed sales was 53.1 in August 2026 versus 73.9 in August 2025. Buyers are also negotiating less. Homes sold for 96.8 percent of their original list price in August 2026, compared with 93.1 percent a year earlier.
A note on the data: every figure in this post comes from the MLS for single-family residential sales in the city of Fleming Island, and between 15 and 49 of those homes close in a typical month. Because small samples move around, I trust patterns that repeat across two years more than I trust any single month.
Are Fleming Island home prices going up or down?
Fleming Island prices are holding, not falling. The median asking price for active single-family listings was $484,900 in August 2026, about 2 percent above the $475,000 median in September 2025. Meanwhile, homes sold for 98.7 percent of their final list price in August 2026.
However, do not read much into the monthly median sold price, because it swings with the mix of homes that happened to close. For example, the median sold price was $385,000 in August 2025 and $504,500 in August 2026, an apparent 31 percent jump. Nobody’s house gained 31 percent in a year. Instead, a different set of houses closed.
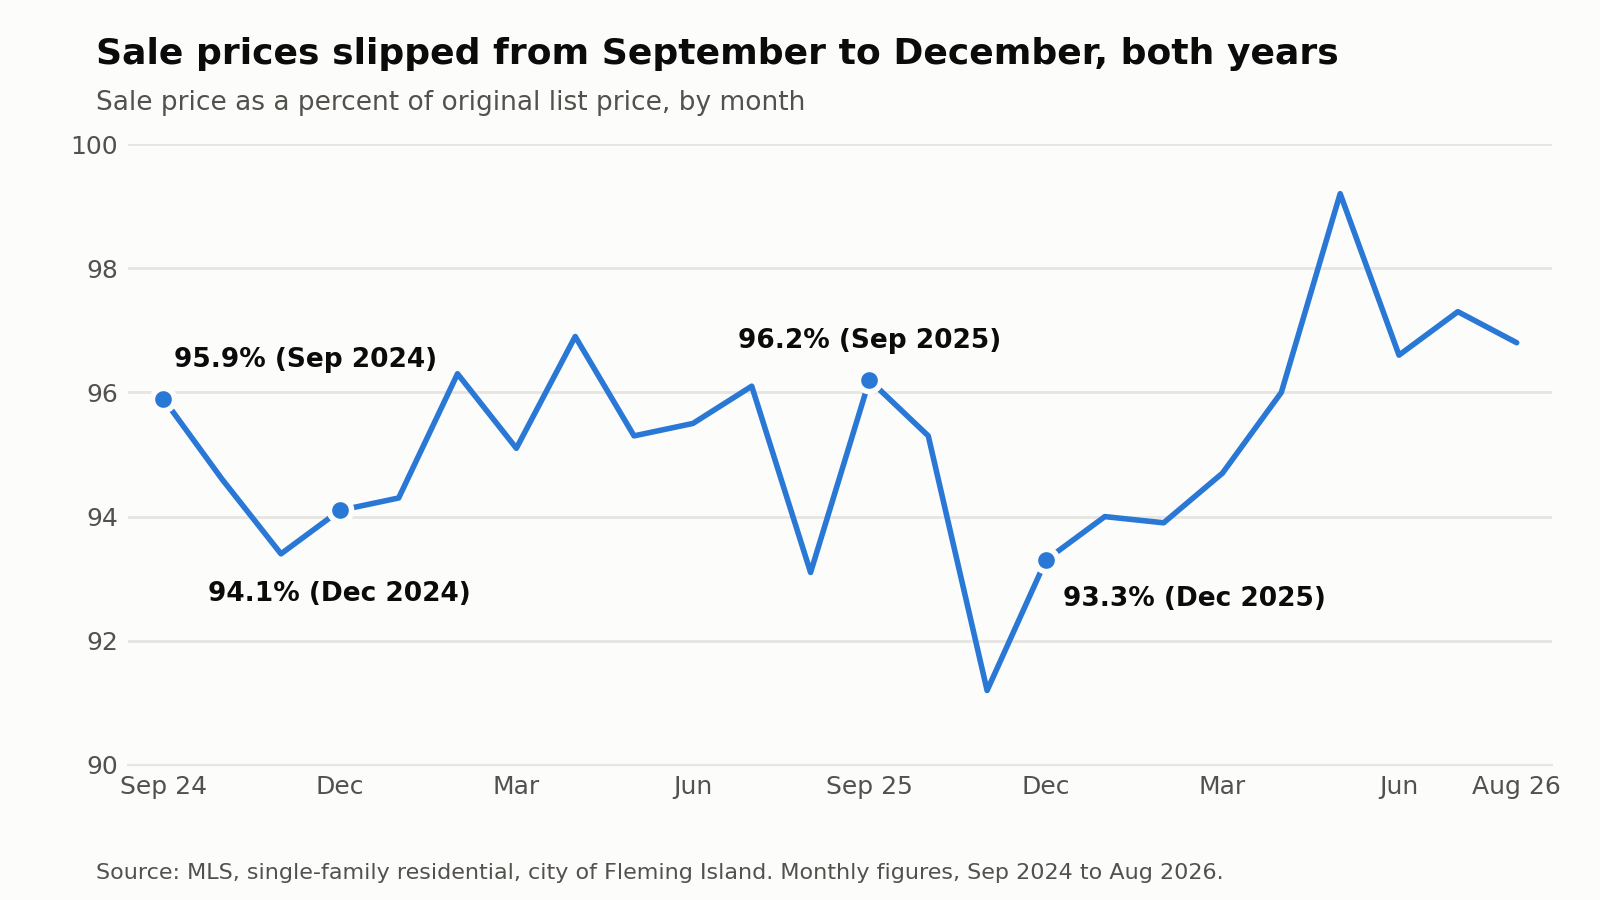
The number I trust more is the sale-to-original-list ratio, because it shows how much room buyers took off the first price. Over the 24 months I reviewed, it ran from a low of 91.2 percent in November 2025 to a high of 99.2 percent in May 2026. That spread is where a seller’s decision lives.
Is buyer demand in Fleming Island slowing down?
Not by the year-over-year numbers, although buyers are not lining up either. Closed sales were 38 in August 2026 versus 45 in August 2025, so the homes selling quickly are the ones priced to the comps.
Contracts written dropped from 41 in July 2026 to 25 in August, which looks alarming until you check last year. In fact, Fleming Island wrote 45 contracts in July 2025 and only 25 in August 2025. Because August dipped last year too, I would not read it as a new trend.
What is the best time of year to sell a house in Fleming Island?
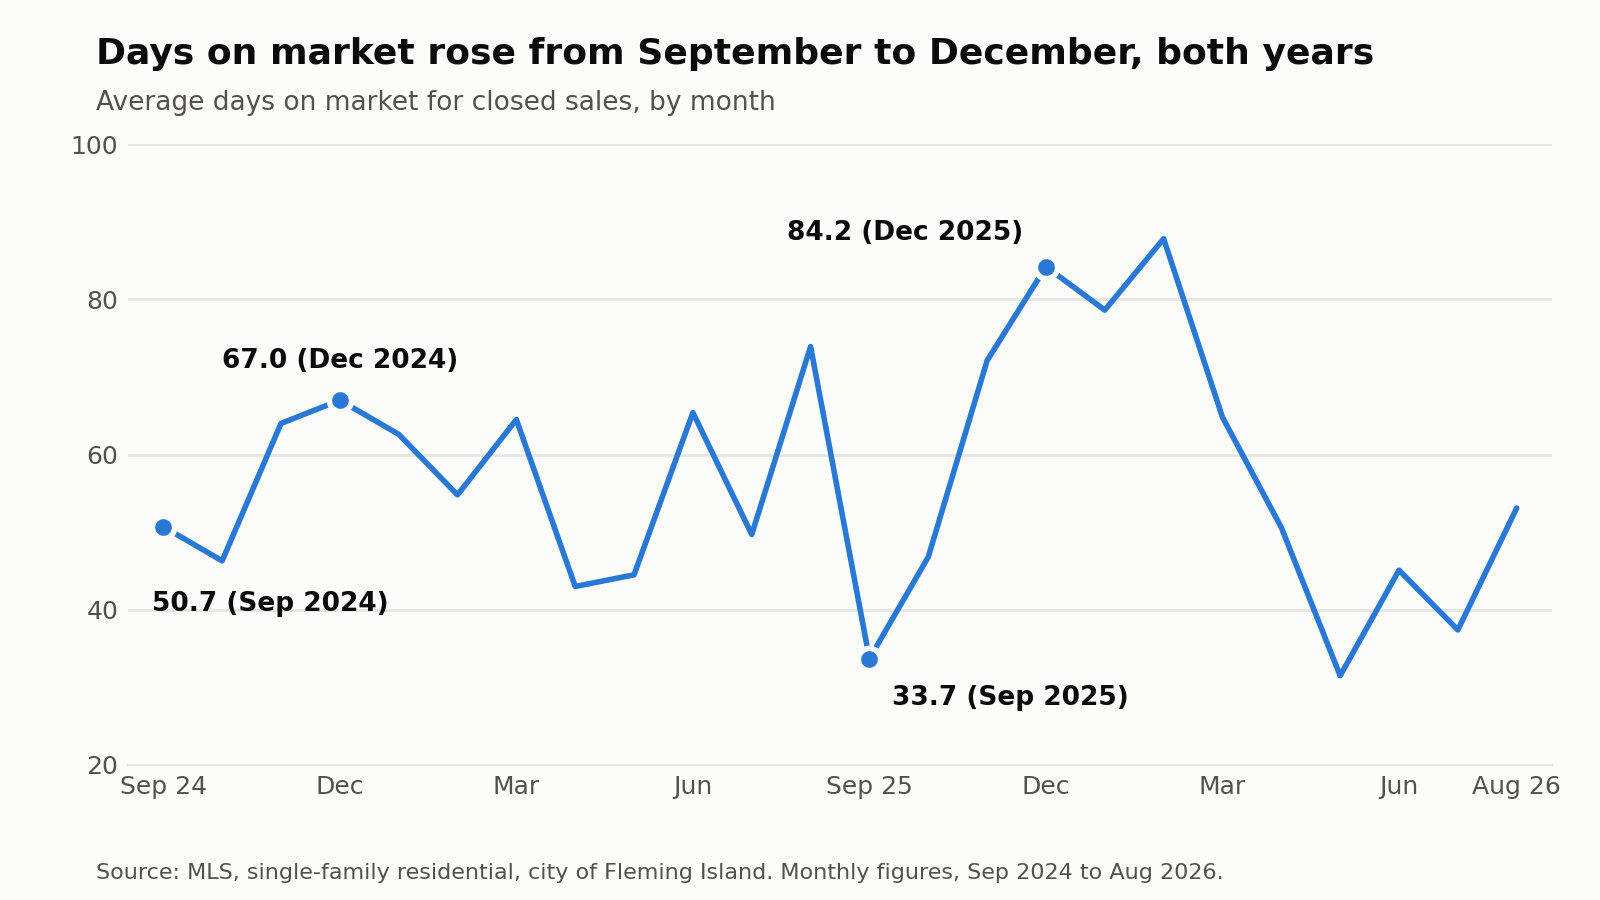
Fleming Island sellers have done best in spring and early fall and worst from November through January. In both 2024 and 2025, average days on market rose while sale-to-original-list ratios fell between September and December.
Here is the September-to-December comparison for each of the last two years. It is the most useful table I can give a homeowner who is choosing between an October listing and a January listing.
| Fleming Island single-family MLS metric | Sep 2024 | Dec 2024 | Sep 2025 | Dec 2025 |
| Average days on market (closed sales) | 50.7 | 67.0 | 33.7 | 84.2 |
| Sale price as % of original list price | 95.9 | 94.1 | 96.2 | 93.3 |
| Sale price as % of final list price | 98.6 | 97.5 | 98.3 | 96.6 |
| New listings | 34 | 30 | 39 | 28 |
| Listings under contract (pended) | 24 | 15 | 30 | 17 |
Source: MLS, single-family residential, city of Fleming Island. Monthly figures.
Why does winter cost Fleming Island sellers money?
Winter costs sellers money because buyers disappear faster than competing listings do. From September to December, new listings fell 12 percent in 2024 and 28 percent in 2025. Meanwhile, listings under contract fell 38 percent and 43 percent. Still, fewer competing homes offer only a thin advantage when the buyer pool shrinks faster than the inventory.
The cost is measurable. For example, on a home listed at $484,900, the current median asking price, the September-to-December slide in the sale-to-original-list ratio was 1.8 points in 2024 and 2.9 points in 2025. That works out to roughly $8,700 to $14,100 in sale price, and that is before you count the extra weeks of mortgage, insurance, and property tax while the house sits. However, these are illustrative figures from averages across all Fleming Island homes, not a forecast for any one house.
Should I wait until spring to sell my Fleming Island house?
Waiting for spring makes sense only if you have no deadline and can carry the house through winter without paying for two homes. Spring 2026 paid well. In fact, May 2026 posted a 99.2 percent sale-to-original-list ratio and 31.5 average days on market, the strongest pricing month in the 24 I reviewed.
However, spring is not a sure thing. May 2025 came in at only 95.3 percent, and spring is crowded, with 66 new listings in April 2026 versus 44 in August. As a result, waiting trades a known fall window for an unknown spring one.
I run three tests with sellers who are on the fence.
The deadline test
If you need to close by a specific date because of a relocation, a school year, or a purchase, count backward. Start with your closing period, then add the roughly 53 days homes averaged on market in August 2026, and finally add the time it takes to price and prepare the house. Therefore, for an October launch, that clock starts this week.
The price test
Are you willing to price to the closed comps rather than to what you hope spring will pay? Winter punishes hope. For instance, February 2026 averaged 87.8 days on market and a 93.9 percent sale-to-original-list ratio.
The carrying-cost test
Add up the mortgage, insurance, property tax, and utilities for the extra four or five months. Then check your Clay County homestead exemption and assessment with the Clay County Property Appraiser before you list, so the tax side does not surprise you at closing.
How do mortgage rates change the answer?
Mortgage rates change what buyers can afford to pay, not what your house is worth, so they belong in your pricing strategy rather than your timing decision. Freddie Mac reported that the 30-year fixed rate averaged 6.95 percent on September 17, 2026, up from 6.76 percent the week before and 6.26 percent a year earlier.
For example, on a $400,000 loan, principal and interest at 6.95 percent runs about $2,648 a month versus about $2,465 at 6.26 percent, a difference of roughly $182 a month. That is my own calculation, not a lender quote. Buyers feel that difference in their approval, and it shows up as pressure on price and concessions rather than a reason for you to hold.
Nobody can tell you where rates will be in March. Therefore, a seller who waits for lower rates is betting on two things at once: a rate drop, and a spring market that pays as well as May 2026 did. Also, if you are buying your next home, that same rate applies to your purchase.
What matters more than timing when you sell a Fleming Island home?
Your list price relative to the closed comps matters more than the month you list. The market sets a range, but your pricing decides where inside that range you land.
After 20 years in Northeast Florida real estate, I follow the same four steps on every listing. First, a pricing analysis built on a comp set you can read, plus the number I would defend to an appraiser. Second, prep and staging limited to the short list of fixes that move the sale price. Third, a marketing launch with professional photography and syndication through the Coldwell Banker network. Finally, negotiation through close, including offer review, inspection strategy, and weekly updates.
If you want to be live in early October, this is the week the pricing analysis and prep begin. In other words, that is what “now” means in practice.
What should Fleming Island sellers do in the next 30 days?
Start with three moves this week. First, pull the closed sales near your home from the last 90 days, because a city-wide median hides the fact that Fleming Island neighborhoods price differently. The comps that matter are the ones a buyer would compare against your house.
Second, decide which repairs a buyer’s inspector would flag anyway, and fix those before photos. Third, set a list price from the comps and agree in advance on your trigger for a price review, such as no showings or offers after the first two weeks. That way, a plan made before you list keeps you from reacting emotionally to the first slow weekend.
Frequently Asked Questions
Is it a good time to sell a house in Fleming Island right now?
Yes, for most sellers who can list by early October. As of August 2026, active single-family listings were down about 20 percent from a year earlier (101 versus 127), average days on market was 53.1 versus 73.9, and homes sold for 96.8 percent of original list price versus 93.1 percent. However, the window narrows in November, when days on market rose and price ratios fell in both 2024 and 2025.
What is the best month to sell a house in Fleming Island, FL?
In the last 24 months of MLS data, May 2026 had the highest sale-to-original-list ratio at 99.2 percent, and spring and early fall generally outperformed winter. November through January were the weakest months, with the low at 91.2 percent in November 2025. Still, one strong spring is not a guarantee, since May 2025 came in at 95.3 percent.
How long does it take to sell a house in Fleming Island?
Average days on market for closed single-family sales was 53.1 in August 2026. Over the past 12 months, it ranged from 31.5 days in May 2026 to 87.8 days in February 2026. Because days on market measures time from listing to contract, plan for your closing period on top of it.
Are home prices dropping in Fleming Island?
Not on the evidence in the MLS. The median asking price for active listings was $484,900 in August 2026, about 2 percent above September 2025, and homes sold for 98.7 percent of final list price. However, monthly median sold prices swing widely, from $350,000 to $504,500 over the past 12 months, because only 23 to 46 homes close each month.
Should I wait for mortgage rates to drop before I sell my house?
Rates affect what buyers can pay, not your equity, and no one can time them. The Freddie Mac 30-year average was 6.95 percent on September 17, 2026, versus 6.26 percent a year earlier, which is about $182 more per month in principal and interest on a $400,000 loan. Pricing to the current comps accounts for that, whereas waiting means betting on both a rate drop and a strong spring.
If you are weighing an October listing against spring, I will walk you through the closed sales nearest your home and show you where I would price it and why. The easiest first step is to request a home value estimate on my website. Otherwise, call me at (904) 226-4786 and we will talk through your timeline.
Data note: Market figures are from the MLS for single-family residential homes in the city of Fleming Island, September 2024 through August 2026. Mortgage rates are from Freddie Mac’s Primary Mortgage Market Survey released September 17, 2026. The $ figures for price differences and payment differences are illustrative calculations, not appraisals or lender quotes.
Other Resources
External Authority Resources
- Freddie Mac Primary Mortgage Market Survey
- National Association of REALTORS Research and Statistics
- Clay County Property Appraiser
